Visual Design of The RASA Project
Timeline: 06-10/2023
Category: Multimedia Performance, Immersive Experience, Visual Design
Role: Visual Assistant, Projection Engineer
Tools & Technology: TouchDesigner, MadMapper
Venue: National Sawdust, Brooklyn, New York
Press Release:
https://www.nationalsawdust.org/event/the-rasa-project
https://poisonputtosound.substack.com/p/the-week-over-heard-3
https://mp.weixin.qq.com/s/TUdqyUpThshoLbZxR-bf3w

National Sawdust Marketing Cover
Context
In 2023, I collaborated with a transdisciplinary team of musicians, neuroengineers, choreographers, and visual artists to create THE RASA PROJECT, a multimedia performance responding to the escalating climate crisis. Presented by National Sawdust, the project reimagined John Cage’s fascination with indeterminacy by immersing the audience in real-time, neurogenerated projections.Performed by students and alumni from Manhattan School of Music, Columbia University, Yale’s Geffen School of Drama, Peridance Center, and Tsinghua University, the work invites a poignant reflection on generational climate anxiety and the decay of the planet.
My contributions included visual design and addressed technical challenges in projection mapping.

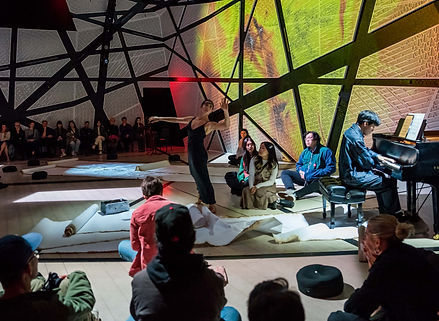
Photography by Maria Baranova
Process
1) Research & Planning
The performance centered around the spirit of planet Earth, embodied by a dancer navigating the escalating climate crisis. Her experiences and emotions, synchronized with the music, were visualized in real-time across seven chapters. The goal was to use neuroactivity and musical signals as tools to "paint" dynamically during the performance.
To achieve this, the dancer wore an EEG headband (MUSE: Headband Meditation Tracker and Monitor), transmitting EEG data to a computer. Simultaneously, a microphone captured musical instrument signals, which were also fed into the system.
I conducted research on:
-
EEG signal interpretation: Understaning how different EEG wavebands (e.g., alpha, beta) correlate with emotional states to align with the performance's artistic goals.
-
Real-time audiovisual techniques: Exploring methods for translating live acoustic data into visual output, including techniques such as Fourier Transform for frequency analysis and TouchDesigner for data visualization.
-
Interaction design in live performance: Investigating how to synchronize the visuals with the dancer's movements and musical elements, ensuring a seamless and cohesive audience experience.
Based on the research, we selected TouchDesigner for visual programming, allowing real-time data visualization during the show.
2) Design
Each of the seven chapters featured a distinct color palette, maintaining a cohesive style while allowing for subtle variations to suit the narrative. The visuals were inspired by Chinese ink painting, aiming for fluid, continuous strokes that moved in harmony with the music.
[1] Changable Visual Elements:
-
Brush Type: Each chapter features a unique brush shape.
-
Brush Size: Adjusted based on frequency intensity.
-
Paint Starting Point: Defined by audio dynamics.
-
Overall Displacement: Movement patterns driven by sound changes.
[2] Acoustic signals: Used as the "brush," divided into low, mid, and high frequencies to control real-time painting on the screen. These signals dynamically influenced brush size and paint starting point.

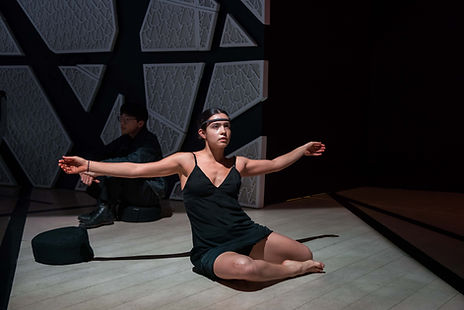
Photography by Jill Steinberg

Frequency-Based Audio Analysis (Programming in TouchDesigner)

"Brush" Types for Each Chapter (Programming in TouchDesigner)

"Brush" Effects Driven by Real-Time Audio Interaction
[3] EEG data: A separate 3D particle system was used to enhance the main visuals by adding depth. High frequency increased the pattern's size and movement speed.
[4] Chapters switch: Set up a simple interaction in TouchDesigner to switch chapters using numpad keys.

Palette for Each Chapter (Programming in TouchDesigner)
3) Challenges & Solutions
[1] Selecting the "brush" data source:
-
Initial consideration: EEG data.
-
Final choice: Acoustic signals, as they provided a more intuitive and visually engaging rhythm that aligned with the music.
[2] Acoustic visualization - Volume vs. frequency:
-
Volume: Too sensitive, resulting in rapid, disruptive changes.
-
Solution: Frequency bands (low, mid, high) were extracted via audio analysis, offering smoother and more structured input for visualization.
[3] EEG visualization integration:
-
Problem: Synchronizing EEG data with acoustic signals.
-
Solution: Represented EEG as "ashes" composed of flying 3D letters, evoking a sense of decay and movement.
-
Data selection: Alpha waves was seleted and amplified to ensure stable input for a cohesive visual effect.

Tranforming EEG Data to 3D Particles (Programming in TouchDesigner)


Final Composites Design with Unified Color Palette
Test Recording of Final Results (Excluding Blank Chapter Four)
4) Collaboration
-
The neuroscientist facilitated data extraction from the EEG headband.
-
Worked closely with the director and choreographer to refine projection mapping visuals
-
Collaborated with musicians to understand the emotion of each piece and translate the music into dynamic visualizations.


Photography by Jill Steinberg
Outcome
FInal Performance Recording at National Sawdust, New York (Oct. 31, 2023).